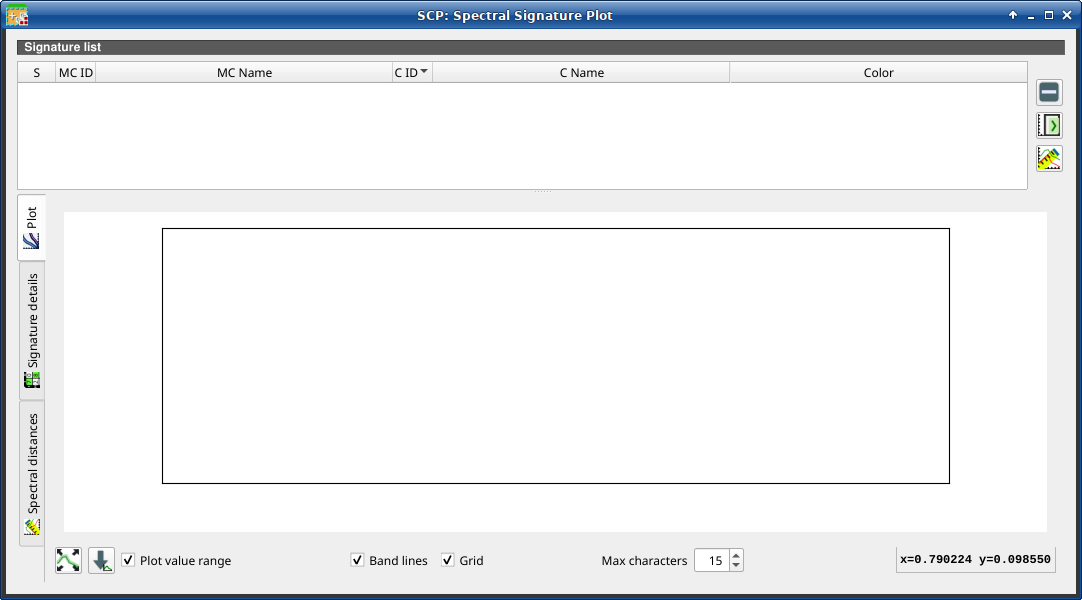
3.5. Spectral Signature Plot
The window Spectral Signature Plot includes several functions for
displaying spectral signature values as a function of wavelength
(defined in the Band set).
Signatures can be added to the Spectral Signature Plot through
the SCP dock.
Overlapping signatures (belonging to different classes or macroclasses) are
highlighted in orange in the table Signature list;
the overlapping check is performed considering MC ID or
C ID according to the setting Use  MC ID C ID in Classification.
Overlapping signatures sharing the same ID are not highlighted.
MC ID C ID in Classification.
Overlapping signatures sharing the same ID are not highlighted.
Spectral Signature Plot
3.5.1. Signature list
The Signature list is a table that includes the spectral signatures added from the SCP dock.
S |
MC ID |
MC Name |
C ID |
C Name |
Color |
|---|---|---|---|---|---|
checkbox field; if checked, the spectral signature is displayed in the plot |
signature Macroclass ID |
signature Macroclass Name |
signature Class ID |
signature Class Name |
signature color; also, the combination MC ID-C ID is displayed in case of overlap with other signatures |
The following tools are available.
Tool symbol and name |
Description |
|---|---|
|
remove highlighted signatures from this list |
|
add highlighted spectral signatures to ROI & Signature list |
|
calculate the spectral distances of spectral signatures displayed in the plot; distances are reported in the tab Spectral distances |


3.5.1.1. Plot
Left click and hold inside the plot to move the view of the plot. Use the mouse wheel to zoom in and out the view of the plot. Right click and hold inside the plot to zoom in a specific area of the plot. Legend inside the plot can be moved using the mouse.
The following tools are available.
Tool symbol and name |
Description |
|---|---|
|
automatically fit the plot to data |
|
save the plot image to file (available formats are |
|
if checked, plot the value range for each signature with a semi-transparent area |
|
if checked, display a vertical line for each band (center wavelength) |
|
if checked, display a grid |
Max characters |
set the maximum length of text in the legend |
x y |
display x y coordinates of mouse cursor inside the plot |


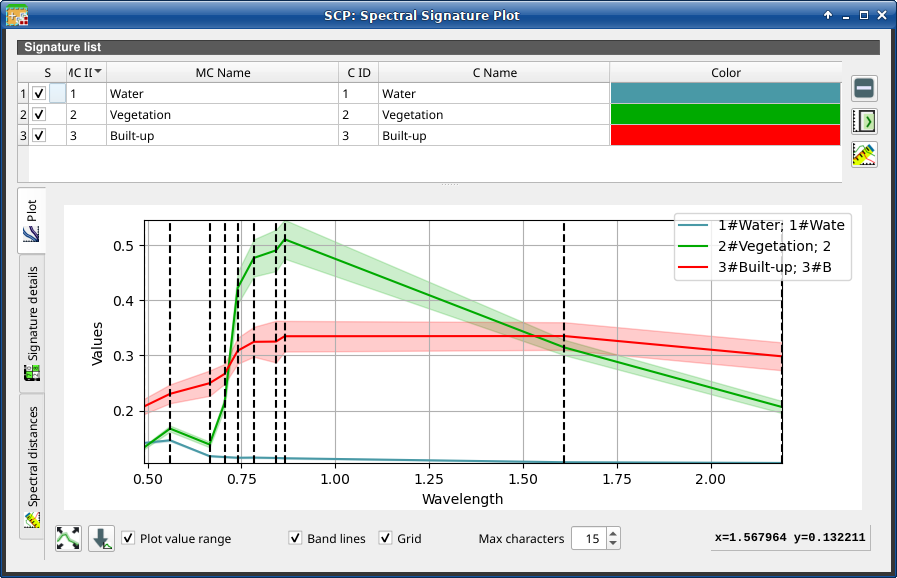
Spectral Signature: Example of plot
3.5.1.2. Signature details
Display the details about spectral signatures (i.e. Wavelength, Values, and Standard deviation). In case of signatures calculated from ROIs, the ROI size (number of pixels) is also displayed.
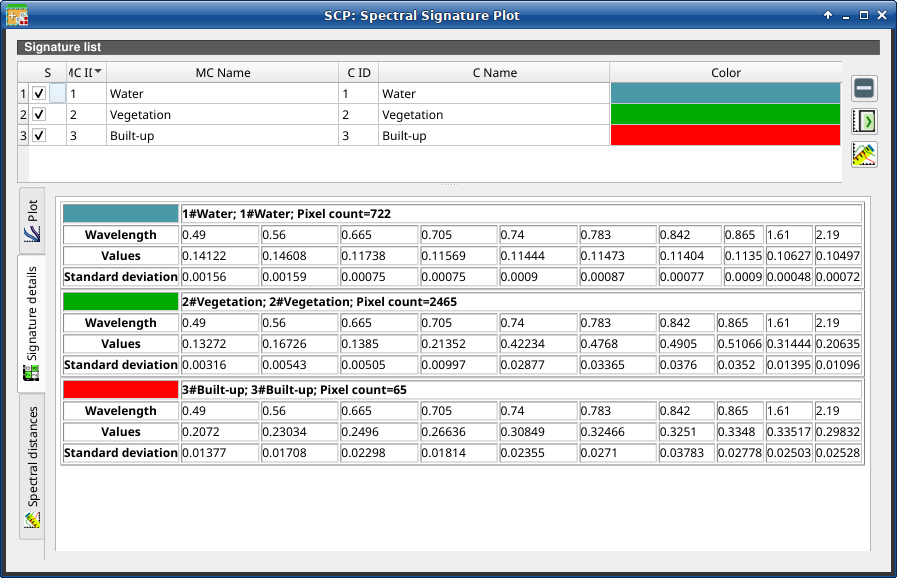
Spectral Signature: Example of signature details
3.5.1.3. Spectral distances
Display spectral distances of signatures (see Signature list), which are useful for assessing ROI separability (see Спектральна відстань).
- The following spectral distances are calculated :
Спектральний кут: range [0 = identical, 90 = different]; useful in particular for Картографування спектрального кута classifications
Евклідова відстань: useful in particular for Мінімальної відстані classifications
Подібність Брея-Кертіса: range [0 = different, 100 = identical]; useful in general
Values are displayed in red if signatures are particularly similar.
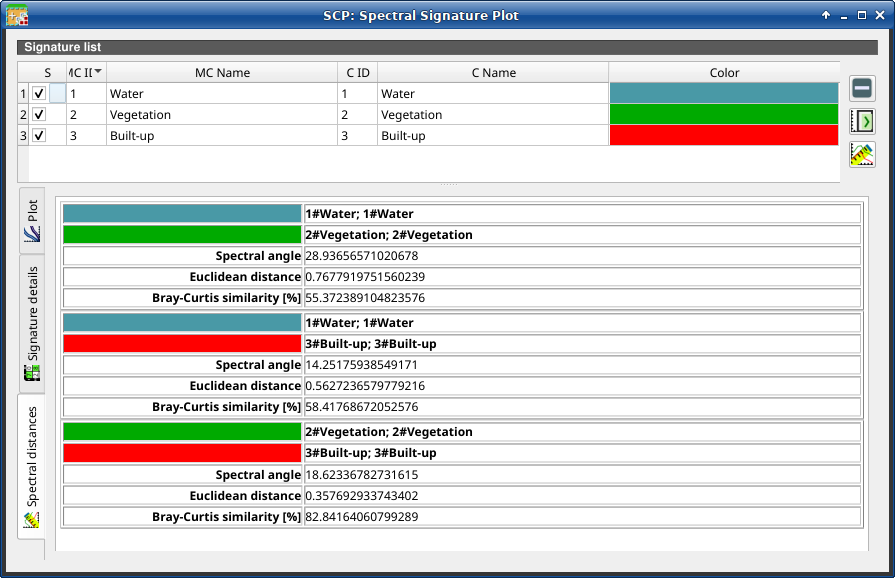
Spectral Signature: Example of spectral distances