3.6. Scatter Plot
The window Scatter plot displays pixel values for two raster bands as points in the 2D space. Scatter plots are useful for assessing ROI separability between two bands.
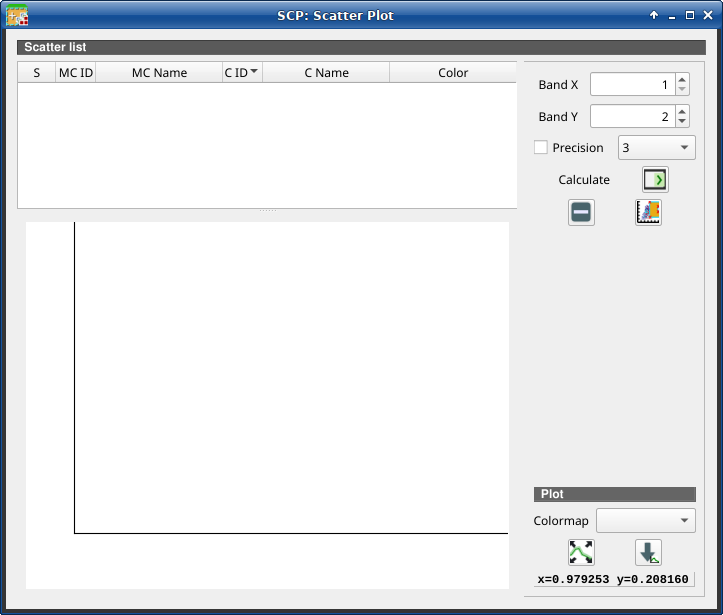
Scatter Plot
The functions are described in detail in the following paragraphs.
3.6.1. Scatter list
The Scatter list is a table that includes the spectral signatures added from the SCP dock.
S |
MC ID |
MC Name |
C ID |
C Name |
Color |
|---|---|---|---|---|---|
checkbox field; if checked, the spectral signature is displayed in the plot |
signature Macroclass ID |
signature Macroclass Name |
signature Class ID |
signature Class Name |
signature color |
The following tools are available.
Tool symbol and name |
Description |
|---|---|
Band X |
X band of the plot |
Band Y |
Y band of the plot |
|
remove highlighted signatures from this list |
|
add highlighted spectral signatures to ROI & Signature list |
|
use custom precision for calculation (precision should be selected according significant digits): * 4 = \(10^{-4}\) * 3 = \(10^{-3}\) * 2 = \(10^{-2}\) * 1 = \(10^{-1}\) * 0 = 1 * -1 = 10 * -2 = \(10^{2}\) * -3 = \(10^{3}\) |
Calculate |
calculate the scatter plot for the ROIs checked in the list |
|
remove highlighted signatures from this list |
|
add a temporary scatter plot to the list (as |


Warning
Using a precision value that is too high can result in slow calculation or failure.
3.6.1.1. Plot
Left click and hold inside the plot to move the view of the plot. Use the mouse wheel to zoom in and out the view of the plot. Right click and hold inside the plot to zoom in a specific area of the plot.
Tool symbol and name |
Description |
|---|---|
Colormap |
select a colormap that is applied to highlighted scatter plots in the
list when |
|
automatically fit the plot to data |
|
save the plot image to file (available formats are |
x y |
display x y coordinates of mouse cursor inside the plot |


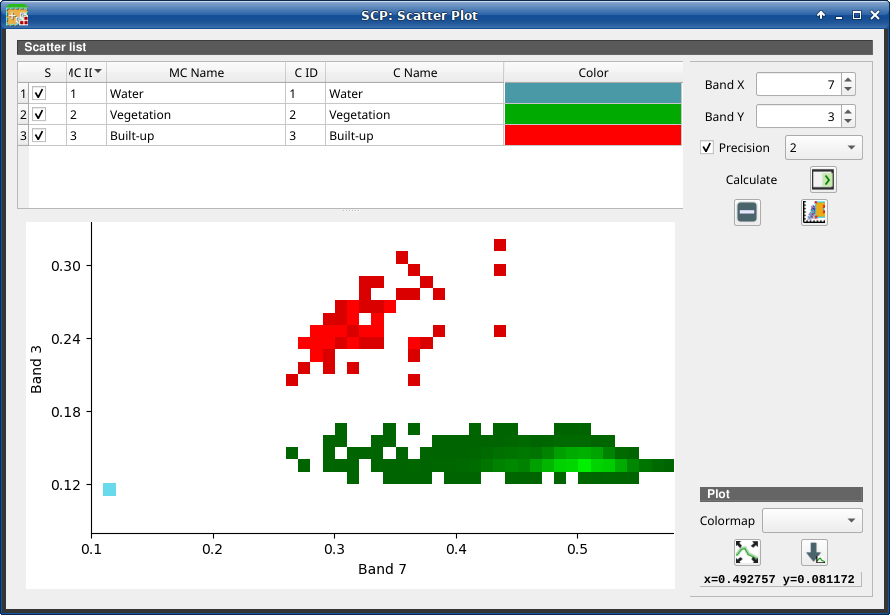
Example Scatter Plot